One phone with speaker, microphone, motion sensors, magnetometer, camera, and depth capture; a drywall panel with known construction. A second phone with supported ranging can add an opposite-side measurement, but relative geometry needs calibration.
Hardware building blocks
Microphone · Speaker · Motion sensors · Magnetometer · Camera · Depth camera · Wi-Fi / Bluetooth
The idea
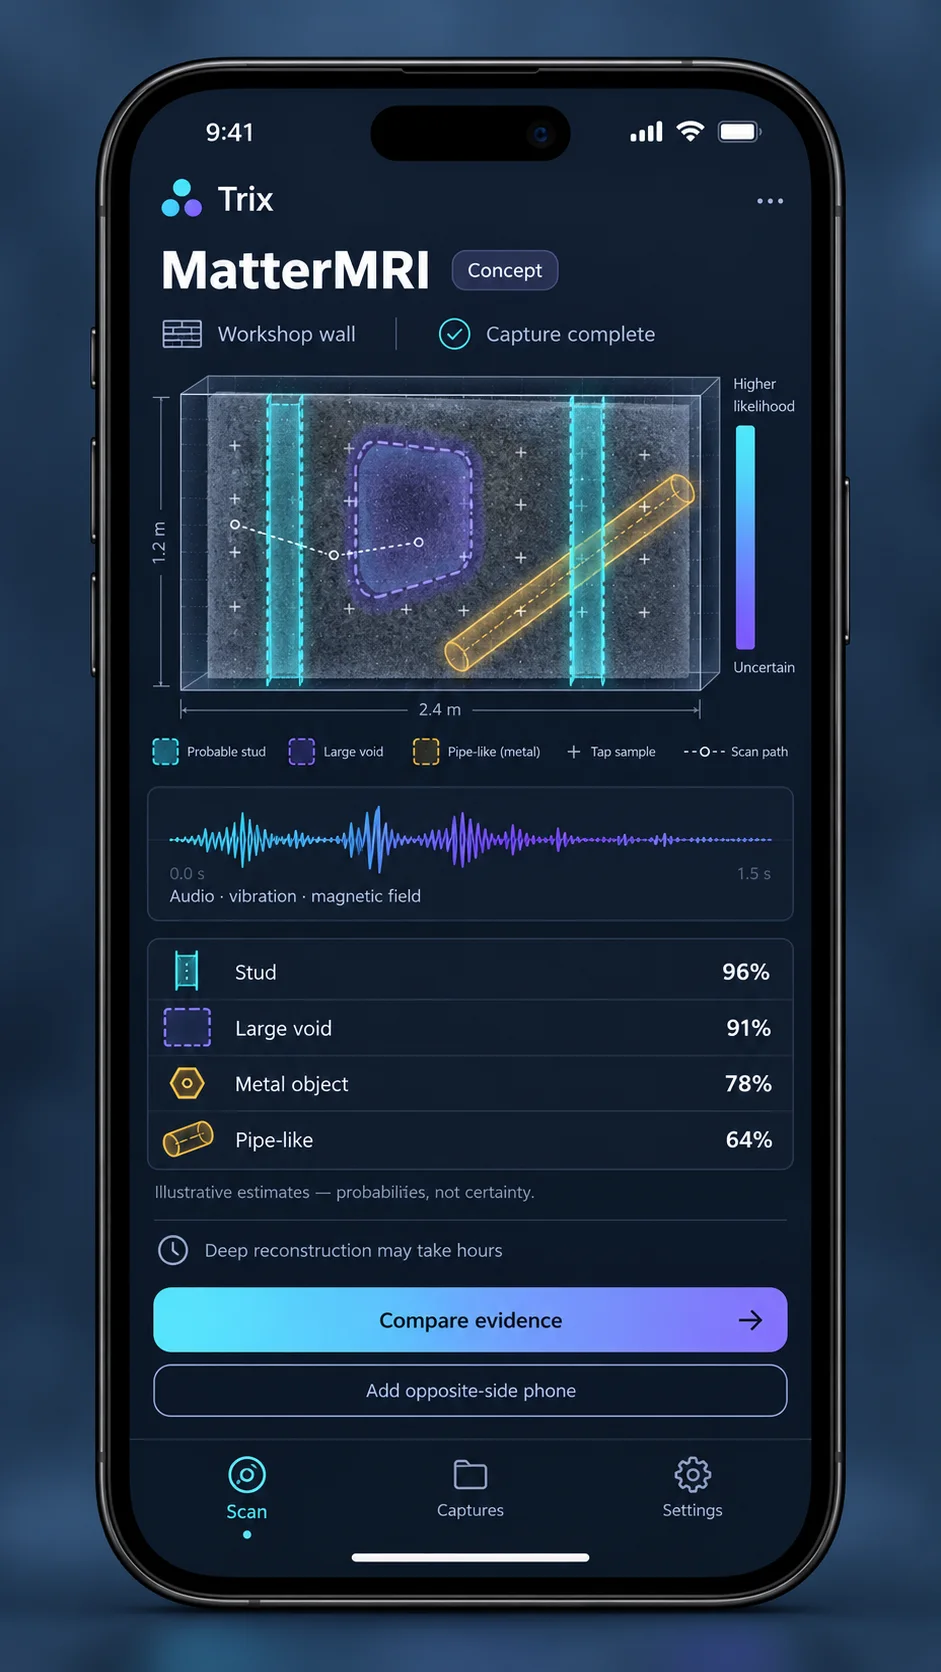
Combine speaker chirps, microphone response, taps, phone vibration and motion, magnetometer readings, and camera or LiDAR geometry to estimate likely hidden structures such as studs, voids, metal, or pipes. Offline analysis may take hours and reports likelihoods, not x-ray certainty.
How it works
Slide a phone along a surface while recording synchronized reusable capture.trix evidence: speaker chirps and microphone response, measured taps, accelerometer and gyro, magnetometer, camera or LiDAR geometry, and timing and calibration metadata.
An offline solver compares candidate hidden structures with the acoustic, vibration, magnetic, and geometric observations; an optional second phone can record chirp transmission and vibration from the opposite side.
Show likely studs, voids, metal, or pipe-like features with confidence and unknown regions, rather than claiming that every material or hidden object can be identified.
AI’s role: Help plan repeated measurements and compare candidate structure explanations; sensor calibration and an offline inverse solver must connect each hypothesis to recorded evidence.
First demonstration
Scan a drywall test panel with known studs and voids, tapping three times at measured positions and repeating paths about 20 cm apart. Compare the estimated structure with the known build; optionally place a second phone on the opposite side to record transmitted chirps and vibration.
What to solve next
How do calibration, contact pressure, acoustic coupling, material differences, and each phone's speaker and sensor response affect repeatability and identifiability?
Related building blocks
These references describe relevant tools or research; they do not demonstrate this complete idea.
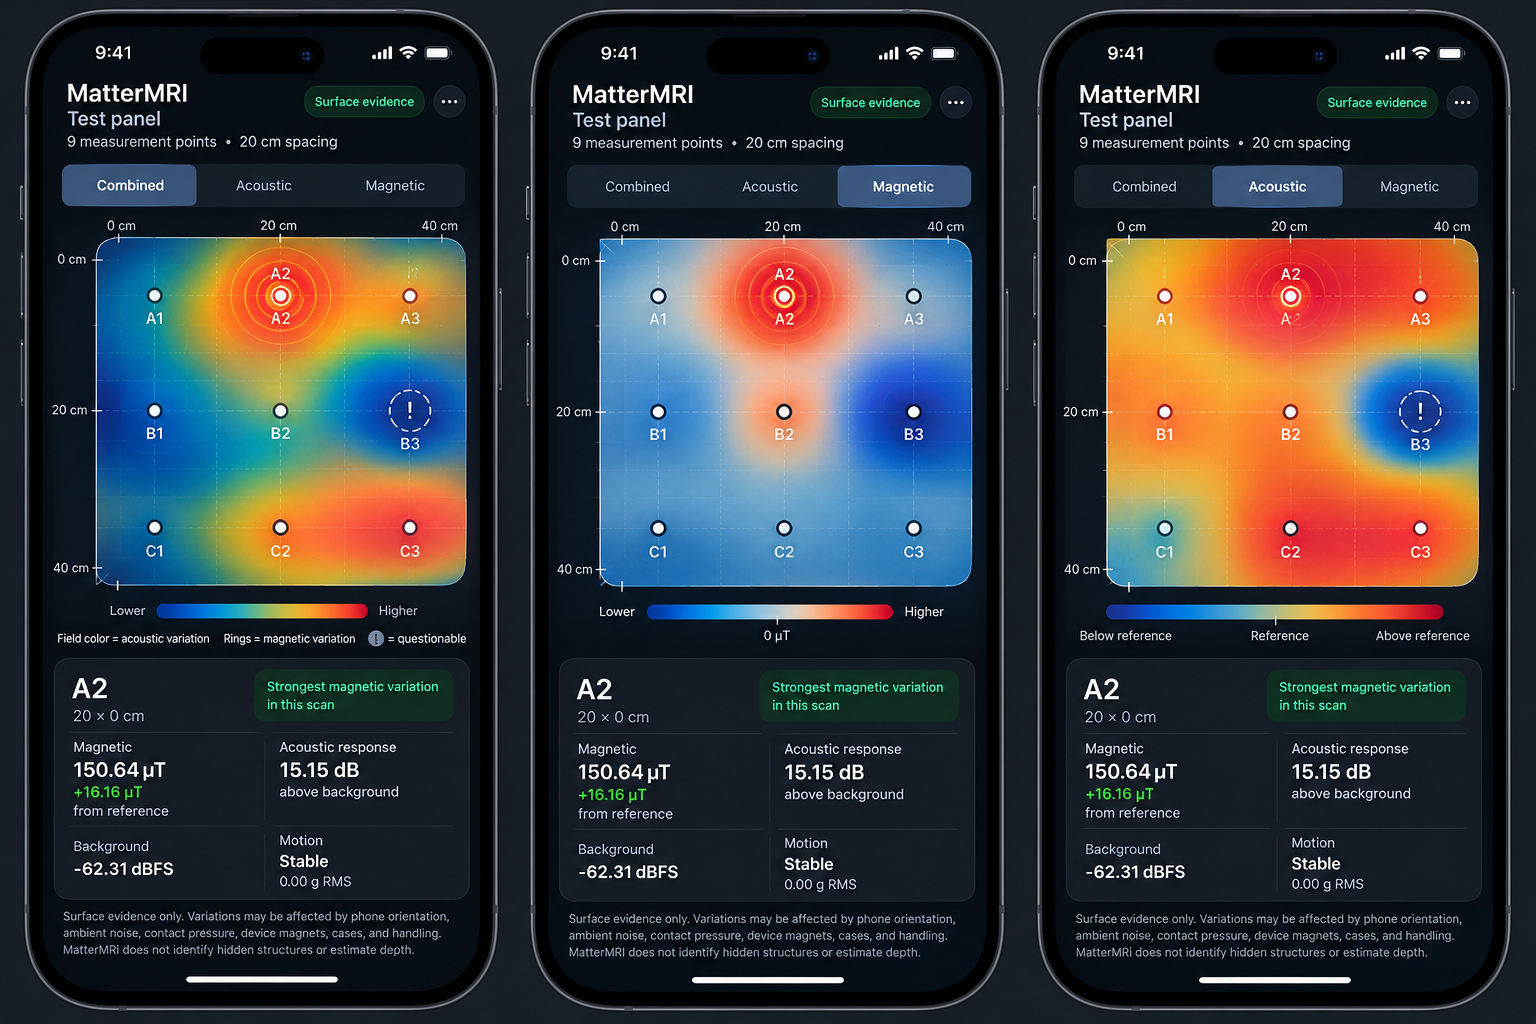
Interface mockup; its heatmaps are illustrative. Exported measured values are shown below.
A2 had the largest magnetic increase: 150.64 µT, +16.16 µT from the 134.48 µT reference. B3’s chirp response is questionable: -52.28 dBFS was below its -50.00 dBFS background.
Ten readings: one reference plus nine points in a manually marked 3 × 3 grid with 20 cm spacing. A1 is the origin; columns run right and rows run down. No camera or depth geometry was measured.
Each reading is an approximately eight-second, 48 kHz mono capture with a two-second, 300–4,000 Hz speaker chirp and three manually cued taps. Motion and gyroscope were requested at 25 Hz; the magnetometer at 20 Hz. The JSON includes timestamped audio power, motion, gyroscope, and magnetic samples. The export references WAV recordings, but those files were not provided.
This is uncalibrated surface evidence only. The hidden structure remains unknown; there are no depth estimates, confidence scores, inverse solver, or AI diagnosis. Handling, orientation, noise, contact pressure, and phone magnets affect comparisons.